Netflix Data Analysis
Exploring Netflix’s global content library, ratings, and trends using Python & Tableau.
About this project
This project dives into a Netflix dataset to uncover patterns in content type, ratings, and genre popularity over time. It combines Python for initial cleaning and Tableau for creating insightful visual dashboards.
Technologies Used
- Python (Pandas, NumPy) for data cleaning and feature engineering
- Tableau for building interactive dashboards and storytelling
- CSV datasets from Kaggle containing Netflix shows metadata
Key Highlights
- Analyzed most frequent genres, maturity ratings, and countries producing Netflix content.
- Built visualizations showing content growth trends since 2010.
- Identified average number of genres per show and duration patterns by type.
- Filtered dashboards to explore recent trends (after 2018).
Sample Dashboards
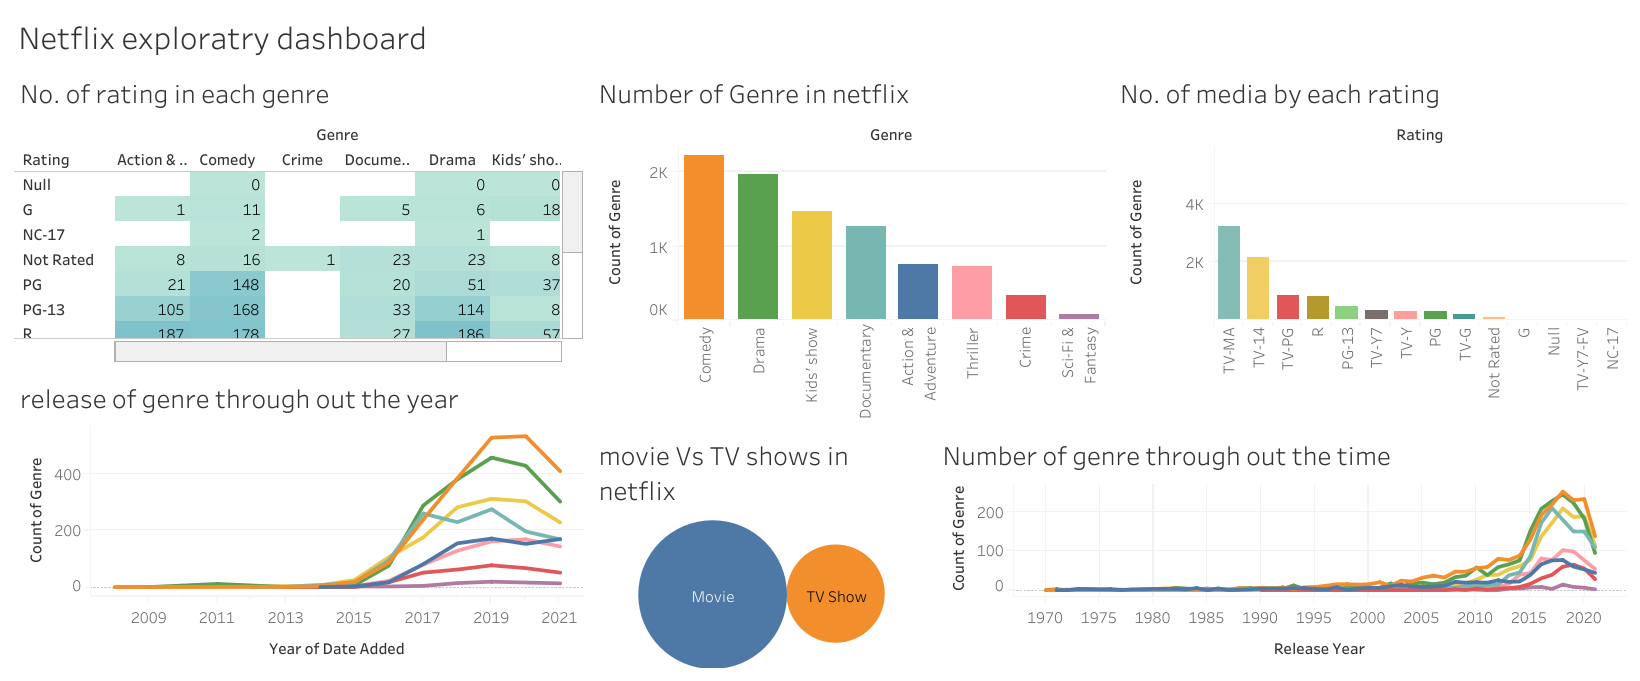
Insights & Learnings
- Majority of Netflix content is TV Shows with PG-13 and TV-MA ratings.
- USA and India are the top producers of Netflix titles.
- After 2018, there’s a surge in genre diversity, indicating Netflix’s strategy to reach varied audiences.
View the Work
Check out the Tableau dashboards on my Tableau Public and the data cleaning notebook on GitHub.